Using model2map
You’ve got your json event log which looks something like:
{"action": "attached", "deferred": 25657144, "errback": null, "callback": "__main__.simpleCallback"}
{"action": "attached", "deferred": 25656712, "errback": null, "callback": "__main__.finished"}
{"action": "executed", "deferred": 25656712, "time": 1.001, "callback?": true, "callback": "__main__.simpleCallback"}
This could be helpful, but does not allow you to look at everything as a whole. model2map is a tool which builds a SquareMap from the deferred’s callback chain and visualizes its execution.
Pipe the file to model2map cat mon.out | monitor2map. Something like this appears:
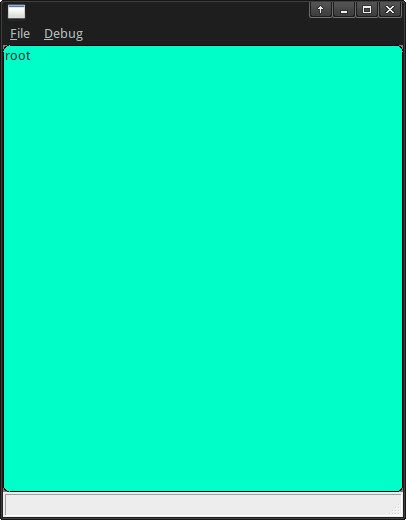
This is the root element. It is just a container for all the tracked objects. You can tell model2map to read the first line from the file from the Debug menu->Next line or CTRL+N.
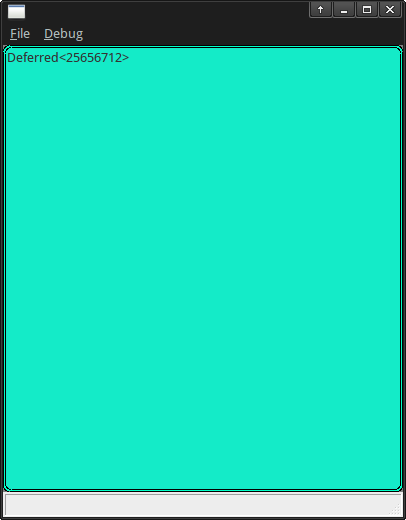
Do this several times till you get something like:
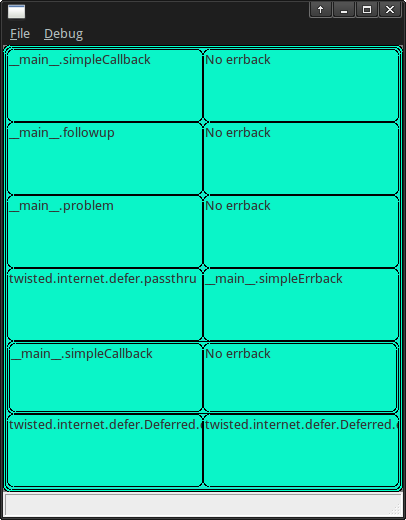
This is the deferred with everything in example.py added to it (including the deferred that was chained, embedded with its callbacks drawned on a deeper depth). After this the deferred is fired and execution begins:
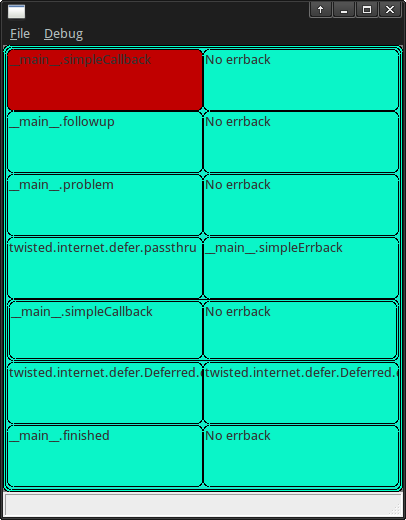
The tile in red is the callback currently executing. When execution finishes the “cursor” will stay at the last executed callback.
Note
For now this rule also applies to chained deferreds too.